Main Menu » Detail Analysis
Detail for Test #514729
Summary
This report refers to a connection test carried out by IP address 1.129.104.59 on 28 Mar 2024 14:56:10 GMT+10:00.| Download Speed (bps) |  12660000 12660000 |
| Upload Speed (bps) |  5281000 5281000 |
| QOS (%) |  79 79 |
| Min RTT (ms) |  35 35 |
| Max RTT (ms) |  1797 1797 |
| Avg RTT (ms) |  38 38 |
| Max Delay (ms) |  46 46 |
| Max route speed (kbps) |  14979 14979 |
| Effective speed (kbps) |  65508 65508 |
| Max TCP connections |  4 4 |
| TCP MTU |  - - |
| TCP forced idle (%) |  78 78 |
| Pkts Norder |  - - |
| Bytes Norder |  - - |
| Pkts Xwindow |  - - |
| Bytes Xwindow |  - - |
| Pkts dup |  - - |
| Bytes dup |  - - |
| Pkts partdup |  - - |
| Bytes partdup |  - - |
| Pkts CRC errors |  - - |
| Pkts bad offset |  - - |
| Pkts too short |  - - |
| Wnd Probes Recvd |  - - |
| Zero wnd updates sent |  - - |
| Bytes lost |  - - |
| ReTx Timeouts |  - - |
| Fast ReTx |  - - |
| Pkts ReTx |  - - |
| Bytes ReTx |  - - |
| Wnd Closed |  - - |
| Pure Wnd Update |  - - |
| Acks for unsent |  - - |
| Dup acks |  - - |
| Wnd probes sent |  - - |
| Persist timeouts |  - - |
| Interface |  - - |
| UQOS (%) |  78 78 |
| UMax delay(ms) |  62 62 |
| UEffective speed (kbps) |  10147 10147 |
| UMax TCP connections |  1 1 |
| UTCP forced idle (%) |  0 0 |
| XL Frames |  - - |
| NA Frames |  - - |
| Short Frames |  - - |
| CRC errors |  - - |
| Overruns |  - - |
| Cut Frames |  - - |
| Download Type |  s1 s1 |
| Upload Type |  s1 s1 |
| Network downtime (sec) |  - - |
| Network uptime (sec) |  - - |
| Network downtime (%) |  - - |
| HTTP 3xx (sec) |  - - |
| HTTP 4xx (sec) |  - - |
| HTTP 5xx (sec) |  - - |
| HTTP ?xx (sec) |  - - |
| Firmware Version |  V3.0.0.39 Built: Nov 30 2023 10:02:31 V3.0.0.39 Built: Nov 30 2023 10:02:31 |
| CPU uptime (sec) |  21 21 |
| FreeQ |  - - |
Test | BizPhone Test |
Analyze this test
Download Test
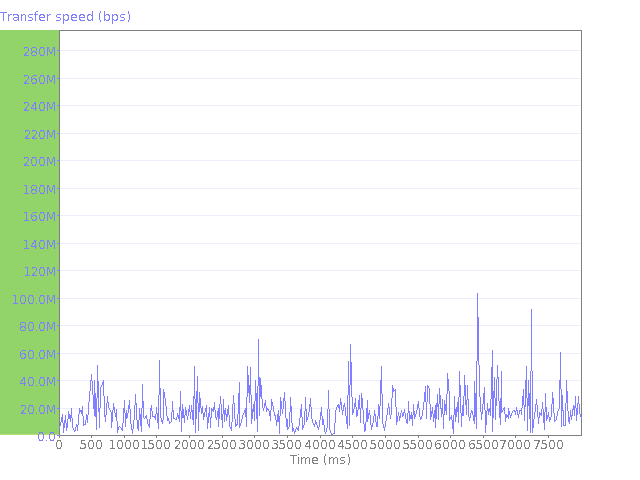
The graphs below illustrate various properties of your Internet connection obtained during the test process. They show the throughput, data and service quality of your connection.Download speed graph: This graph illustrates how your download speed fluctuates over time. You may notice that the maximum download speed shown on the graph is more than the connection speed rated by your ISP. This is usually due to how your connection is regulated. For example, an ISP may supply a 10 Mbit connection by allowing 100 Mbit for 10ms, and pause for 90ms.
The higher the download speed, the better, but a quality connection will also demonstrate very little fluctuation in download speeds. If the graph below shows a rapidly changing speed then this indicates that the data is impacted and the quality of service degraded. Whilst this does not necessarily affect applications such as email it will definitely affect multimedia applications such as video or voice.

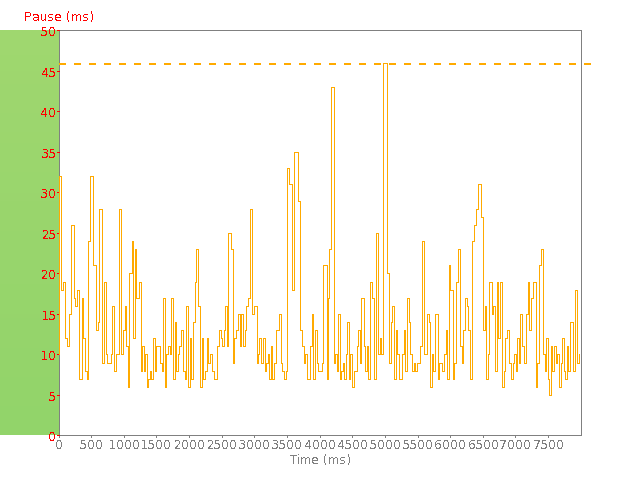
TCP pause graph: Data is sent across the Internet in "blocks". Usually a connection will send a block of data and pause before sending the next. (This pause is known as the TCP pause.) The graph illustrates the TCP pause between receiving subsequent blocks of data. If the pauses become excessive it means that the connection throughput is being degraded.
A good connection will have both a low TCP pause (less than 20 ms), and also demonstrate very little fluctuation in the TCP pause values. This in essence defines a quality of data as it defines how much of the test time was spent actually transmitting data versus being idle waiting for data to arrive.
The - - - - - line shows the maximum TCP pause recorded. If you see many TCP pauses exceeding 80-100ms then it is likely that the connection test is spending more time waiting for data than moving data. If the TCP pause pattern looks very symmetrical and regular then it may indicate that there is a throttling process managing/restricting the data flow. If the TCP pause pattern is more erratic and variable then it would indicate network delays as a result of congestion or other network problems.

Upload Test
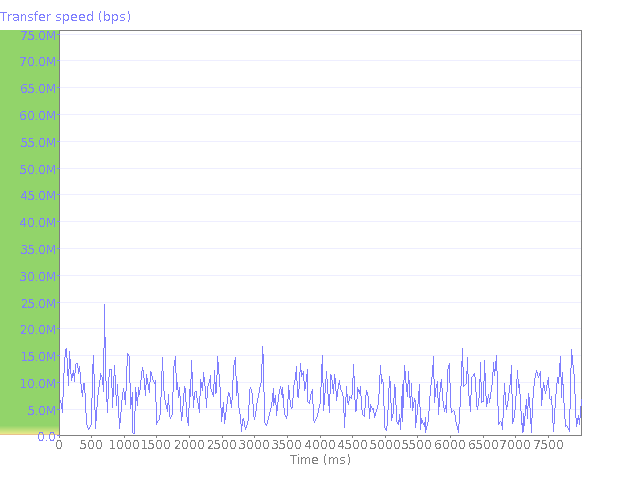
The graphs below illustrate various properties of your Internet connection obtained during the test process. They show the throughput, data and service quality of your connection.Upload speed graph: This graph illustrates how your upload speed fluctuates over time. You may notice that the maximum upload speed shown on the graph is more than the connection speed rated by your ISP. This is usually due to how your connection is regulated. For example, an ISP may supply a 10 Mbit connection by allowing 100 Mbit for 10ms, and pause for 90ms.
The higher the upload speed, the better, but a quality connection will also demonstrate very little fluctuation in upload speeds. If the graph below shows a rapidly changing speed then this indicates that the data is impacted and the quality of service degraded. Whilst this does not necessarily affect applications such as email it will definitely affect multimedia applications such as video or voice.

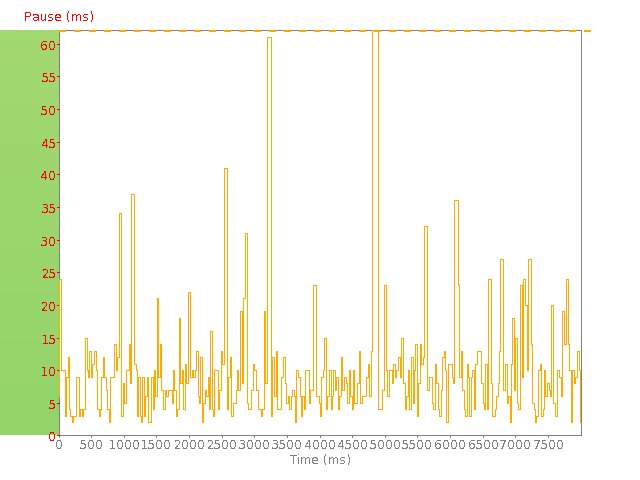
TCP pause graph: Data is sent across the Internet in "blocks". Usually a connection will send a block of data and pause before sending the next. (This pause is known as the TCP pause.) The graph illustrates the TCP pause between receiving subsequent blocks of data. If the pauses become excessive it means that the connection throughput is being degraded.
A good connection will have both a low TCP pause (less than 20 ms), and also demonstrate very little fluctuation in the TCP pause values. This in essence defines a quality of data as it defines how much of the test time was spent actually transmitting data versus being idle waiting for data to arrive.
The - - - - - line shows the maximum TCP pause recorded. If you see many TCP pauses exceeding 80-100ms then it is likely that the connection test is spending more time waiting for data than moving data. If the TCP pause pattern looks very symmetrical and regular then it may indicate that there is a throttling process managing/restricting the data flow. If the TCP pause pattern is more erratic and variable then it would indicate network delays as a result of congestion or other network problems.

Test Audit Report
The test audit report contains an in-depth, technical analysis of the test performed.View Test Audit Report